


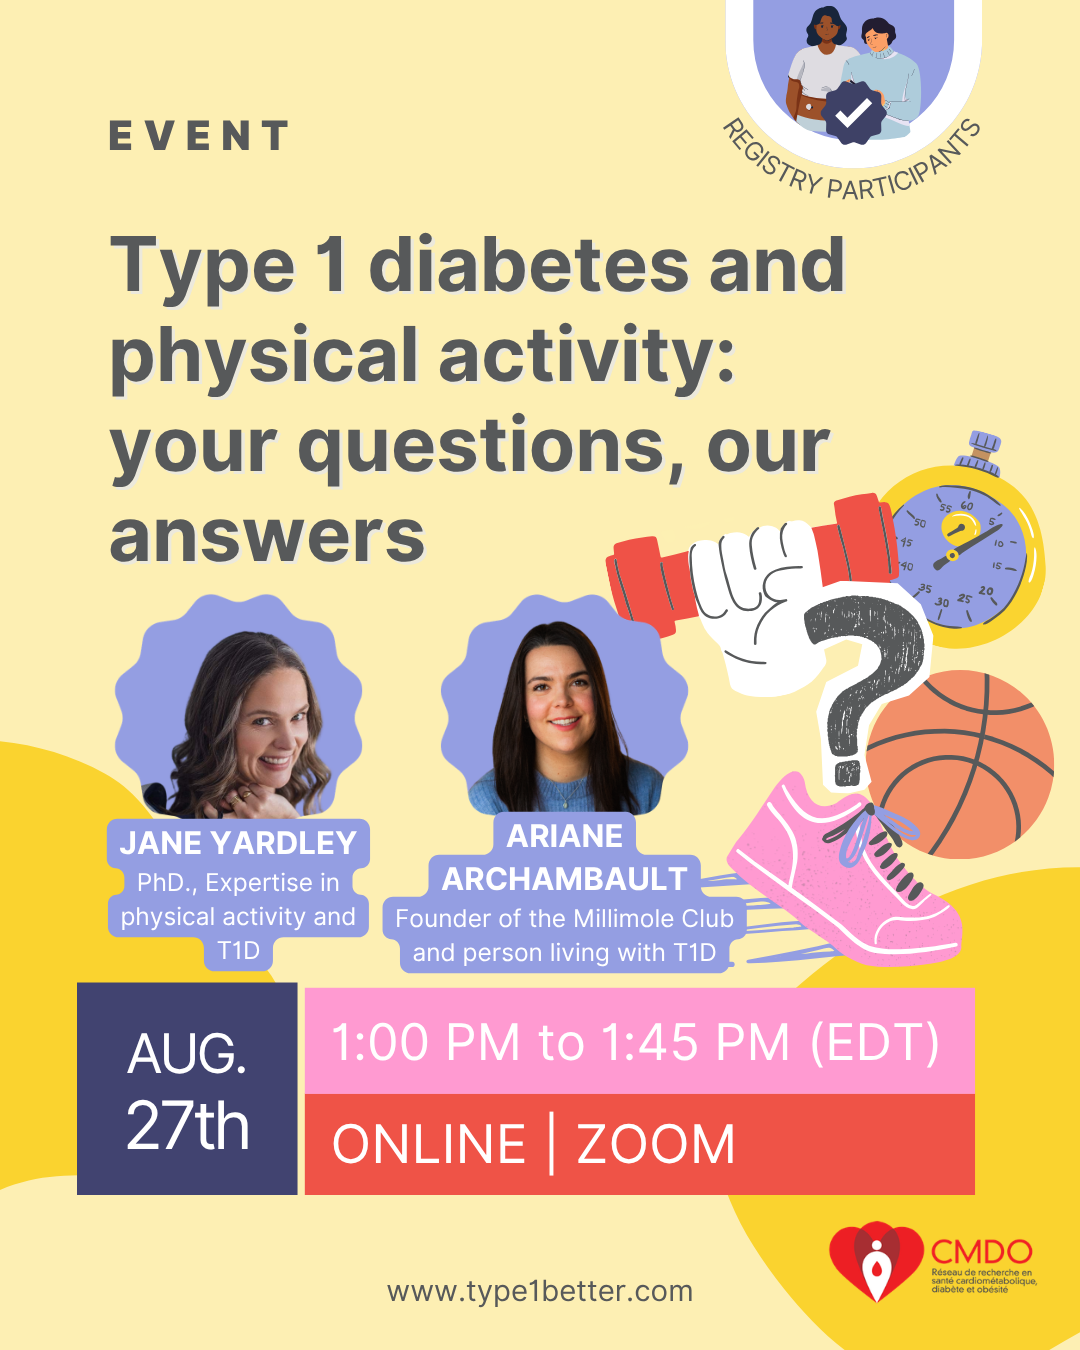
Upcoming Event
Participate in the BETTER registry!
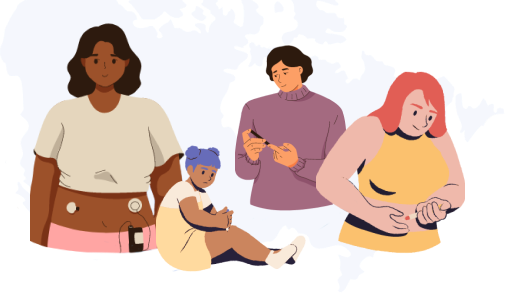
First registry of people living with T1D in Canada.
Learn More
First registry of people living with T1D in Canada.
Learn More